Designing a table to reflect different companies’ org structures and approval processes
A lesson in understanding our users in order to design an adaptable solution for all…rather than going with the most obvious answer.
My role: research & design
Project team: product manager, two engineers, one designer (me)
About Tropic
Tropic is a cost-savings platform for businesses to reduce and control costs.
Tropic combines procurement* workflows, supplier management, and benchmark data to make it easier to save on software purchases.
*Procurement is the process of buying goods or services. It can include a wide range of activities, such as identifying requirements, finding suppliers, negotiating terms, and making purchases.
Context
Organizations usually follow the same basic procurement flow of Requirements Gathering, Negotiation, and Approvals & Signatures.
But within this flow, organizations have unique steps they need to follow.
Most purchases have to be approved by certain teams (legal, finance, etc.).
Example: if a designer requests their organization to buy Adobe Creative Cloud, a workflow would be launched requiring various approvals. Maybe the designer’s manager would need to approve, as well as someone from the finance team.
But not all purchases need to be approved by the same people.
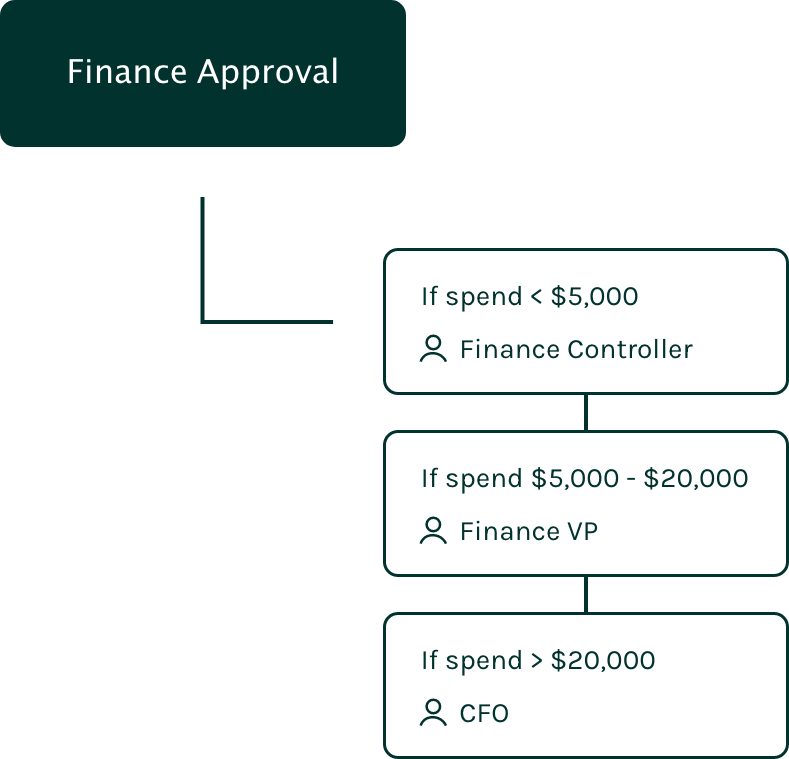
If someone in a medium-sized organization wanted to make a $100 purchase, the CFO probably wouldn’t need to approve it. But if the person wanted to purchase a $20,000 license, the CFO might want to have a say in that.
Each organization that we worked with had different approval processes to follow, and different organization structures.
In order to reflect the flow shown here, Tropic needed to be able to represent each of our customers’ unique organization structures.
The Problem
A lot of customers need the ability to dynamically assign an approval task based on the department and the role of the user in the organization based on factors like budget or other data.
Task assignment was currently limited to only one assignee per department, with no accounting for role.
Current Page
The existing Departments page on Tropic was a table with 3 columns:
Department Name
Department Manager
Department Internal ID
We essentially allowed each department one manager (or approver).
This worked fine when an employee needed the head of their department to approve a purchase.
But any purchase could require an approval from the Finance team. And if there could only be one Finance department manager, we had no way of reflecting hierarchies in approvals & different roles within a department.
Exploring the problem
After discussing with the team’s product manager, I felt I understood the problem that customers were facing, and what we wanted to solve.
But I wasn’t quite ready to design a solution yet. First, it was time to ask more questions. Here are a few questions we discussed":
How many departments do organizations generally have?
Should one role have multiple assignees?
Are role titles the same across departments?
Does every role need to have an assignee?
What is the goal of a user who visits the Departments table?
Solutioning
1st iteration
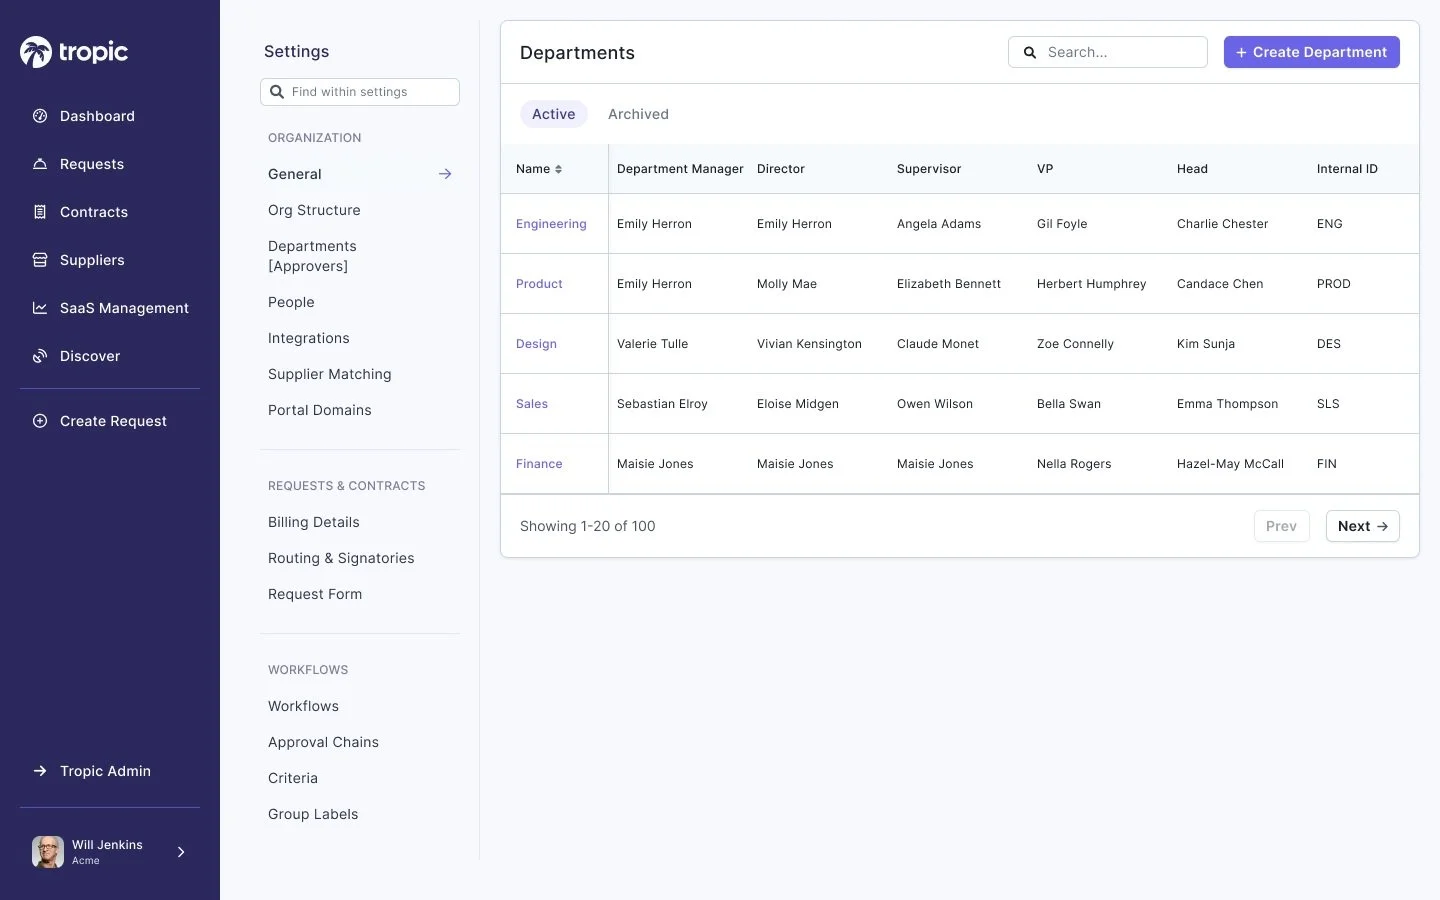
In first discussing the problem, a solution had been suggested. Why not just add n columns, one for each role?
The problem:
Not all departments would have the same titles. For example, only the Finance department had a role called “Controller”. This solution wasn’t scalable or adaptable enough to fit different organization structures.
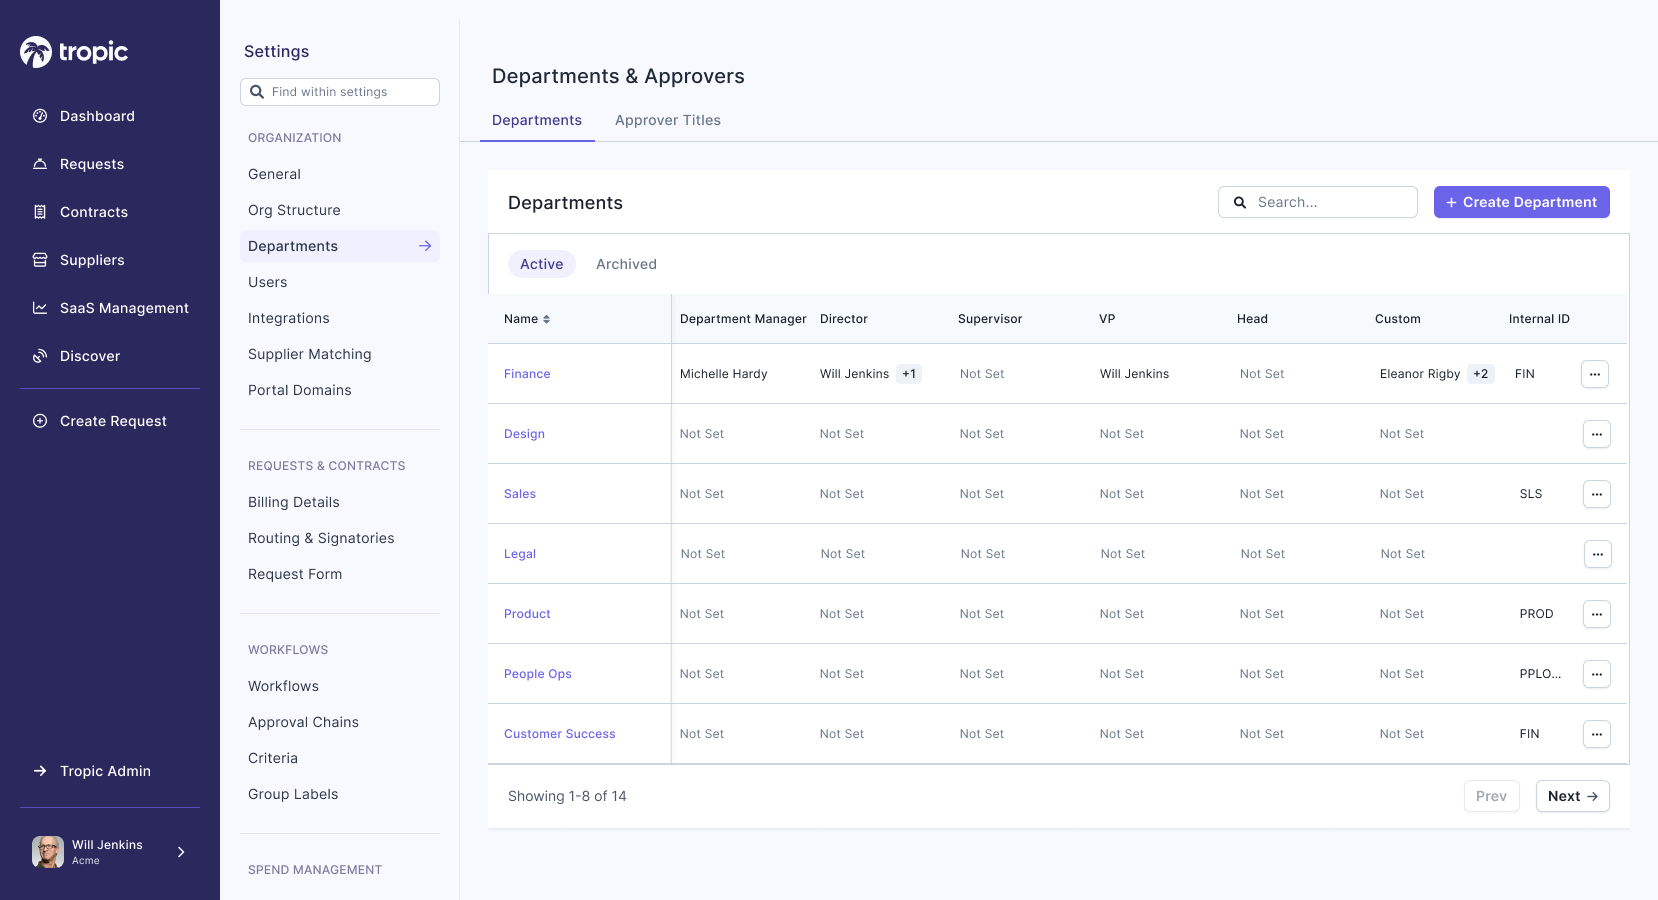
So certain departments might have specific title names. But if most titles are the same across departments, maybe all we needed was the ability to add “Custom” titles in each department.
The problem:
The Custom title column was a quick fix, but didn’t give users visibility into who the approvers are.
We got feedback that it’s important for users to be able to scan table for approvers in each department.
2nd iteration
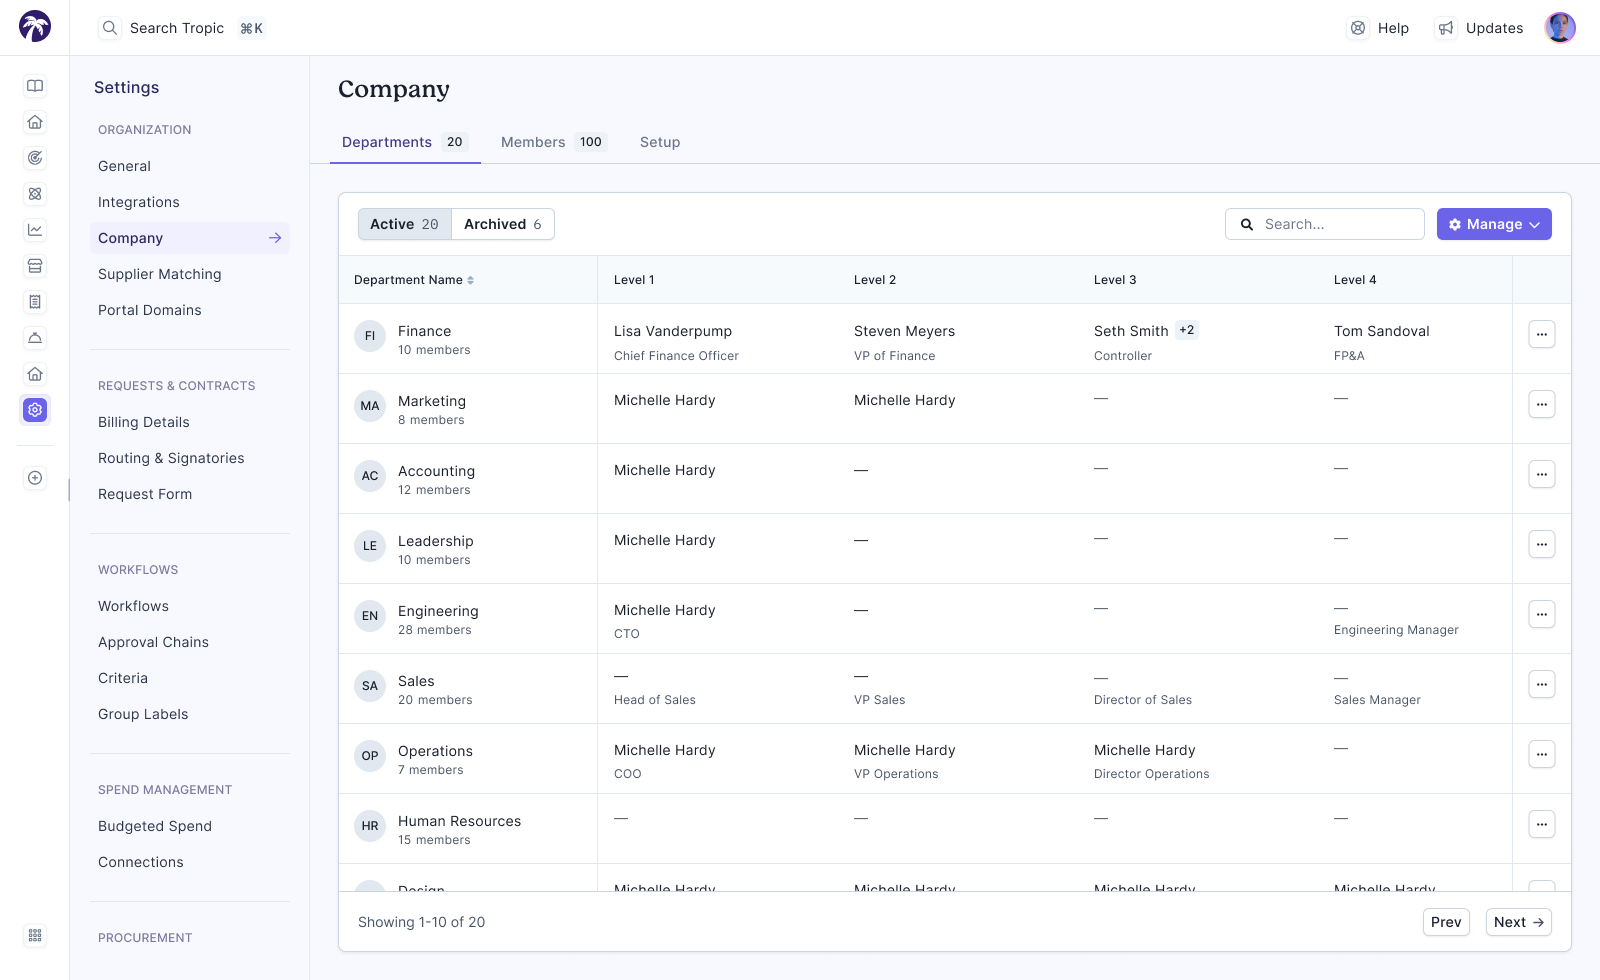
In the end, we decided to allow all titles to essentially be custom titles.
Users can name each title according to the specific department.
We pre-set the top level name as “Level 1”, “Level 2”, etc. because many customers had asked for the ability to add hierarchy. But even these level names would be customizable if users had different naming standards, or didn’t want to enforce any hierarchy.
3rd iteration
Usability Testing
We conducted usability testing by asking our participants to answer questions about the table structure itself, then asked them to complete tasks like creation & editing of titles, level names, & approver assignments.
First, we tested our prototype with 5 internal implementation consultants who were responsible for organization setup with new customers. We got strong approval from them, so next, we tested with 5 customers.
All of our test participants were able to answer questions about the organization of the table, and 100% completed tasks successfully. We got really positive verbal feedback as well, and our customers were excited to see the new table implemented.
Prototype
A note on Accessibility
I worked with the design team to think about how to make our tables more accessible. One area of concern was the empty state of a table cell.
Our existing standard was to fill the cell with text “Not Set” in a lighter gray (rather than the dark gray filled state).
The problem with this was that it made tables hard to scan for filled vs unfilled cells. Additionally, using different shades of gray wasn’t a very effective way of differentiating.
I considered leaving the cells empty so that scanning would be easier. But screen readers don’t read out empty content without ARIA labels.
After looking into existing research, I settled on using the em-dash “—” and used ARIA labels so that screen readers would be able to read out what type of empty state it was.
We also set this as a standard across the rest of the Tropic platform.
Looking back
At the beginning of this project, it felt so straightforward that we almost jumped into the solution right away. It ended up being more complicated as we really dug in to different organizations and how they were structured. We realized that rather than opting for the simplest and easiest to implement option, we needed to prioritize customizability within the table.
Before we implemented this new table, our internal implementation consultants were setting up organizations for our customers. But with this new table, the goal was to hand over the setup process to our customers. We needed the setup to be straightforward for users who were doing this for the first time.
With this new process, we gave autonomy to our customers, and saved hours and hours of time for our internal onboarding team.


